• 论文
主办单位:煤炭科学研究总院有限公司、中国煤炭学会学术期刊工作委员会
锡林浩特矿区土壤水分特征曲线和有效含水量预测
  • Title

    Soil moisture characteristic curve and prediction of available water content of overburden in Xilinhot Mining Area

  • 作者

    王鑫肖武刘慧芳赵艳玲田帅帅邹玉珠

  • Author

    WANG Xin, XIAO Wu, LIU Huifang, ZHAO Yanling, TIAN Shuaishuai, ZOU Yuzhu

  • 单位

    中国矿业大学(北京)土地复垦与生态重建研究所浙江大学公共管理学院

  • Organization
    1.Institute of Land Reclamation and Ecological Restoration, China University of Mining and Technology-Beijing,Beijing , China;2.School of Public Affairs, Zhejiang University,Hangzhou , China
  • 摘要

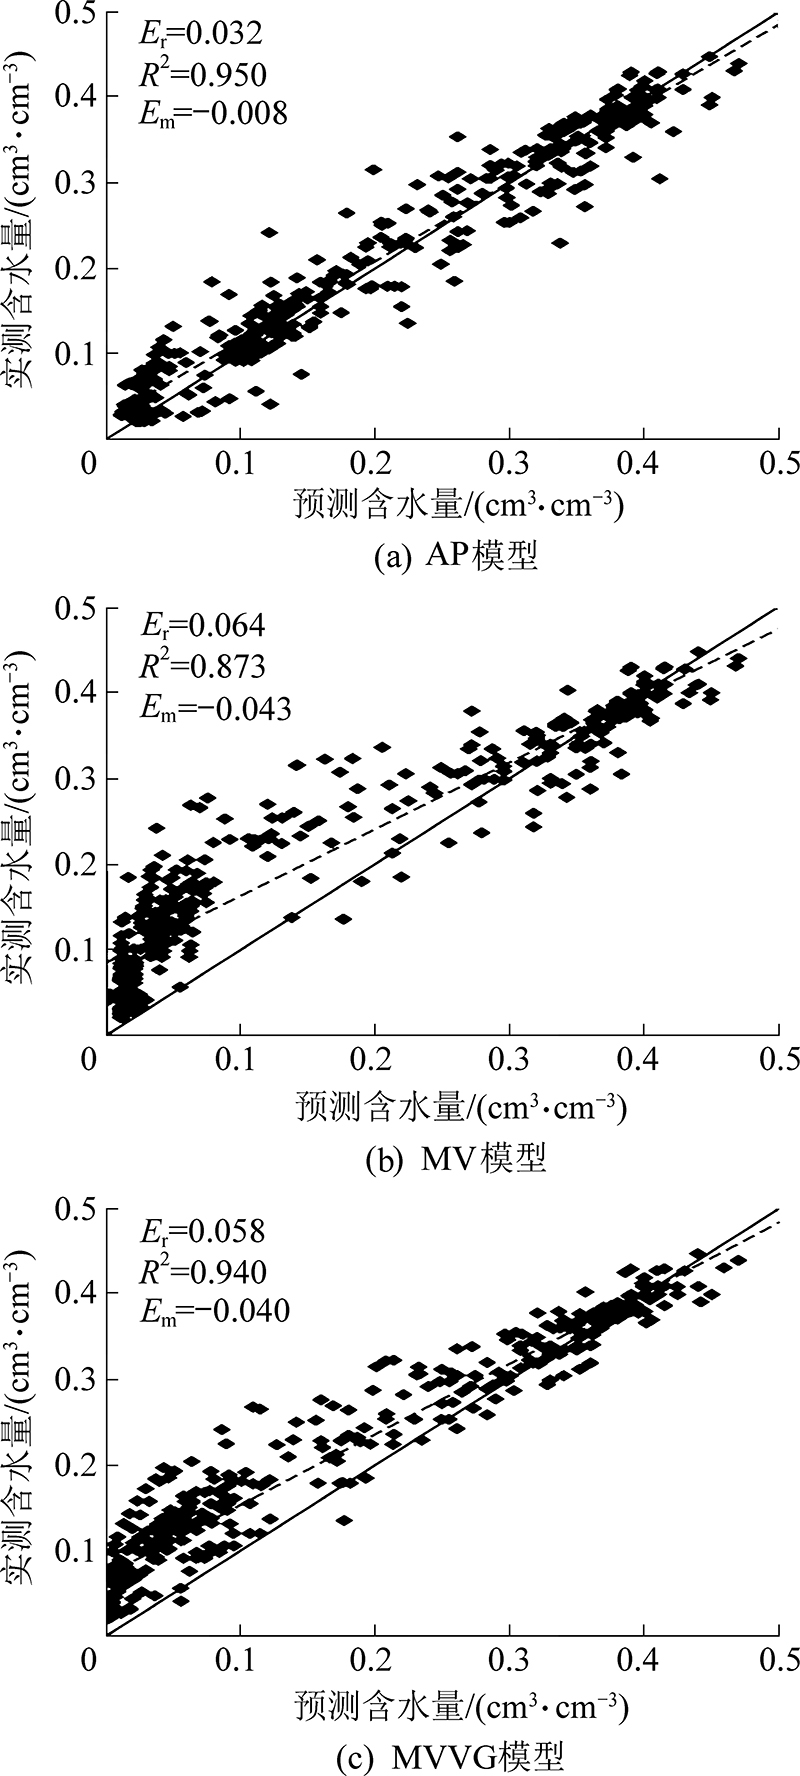
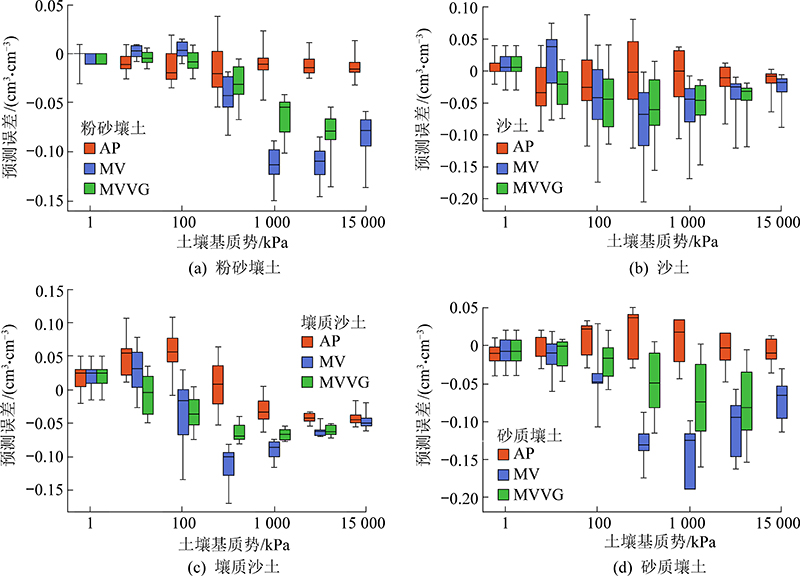
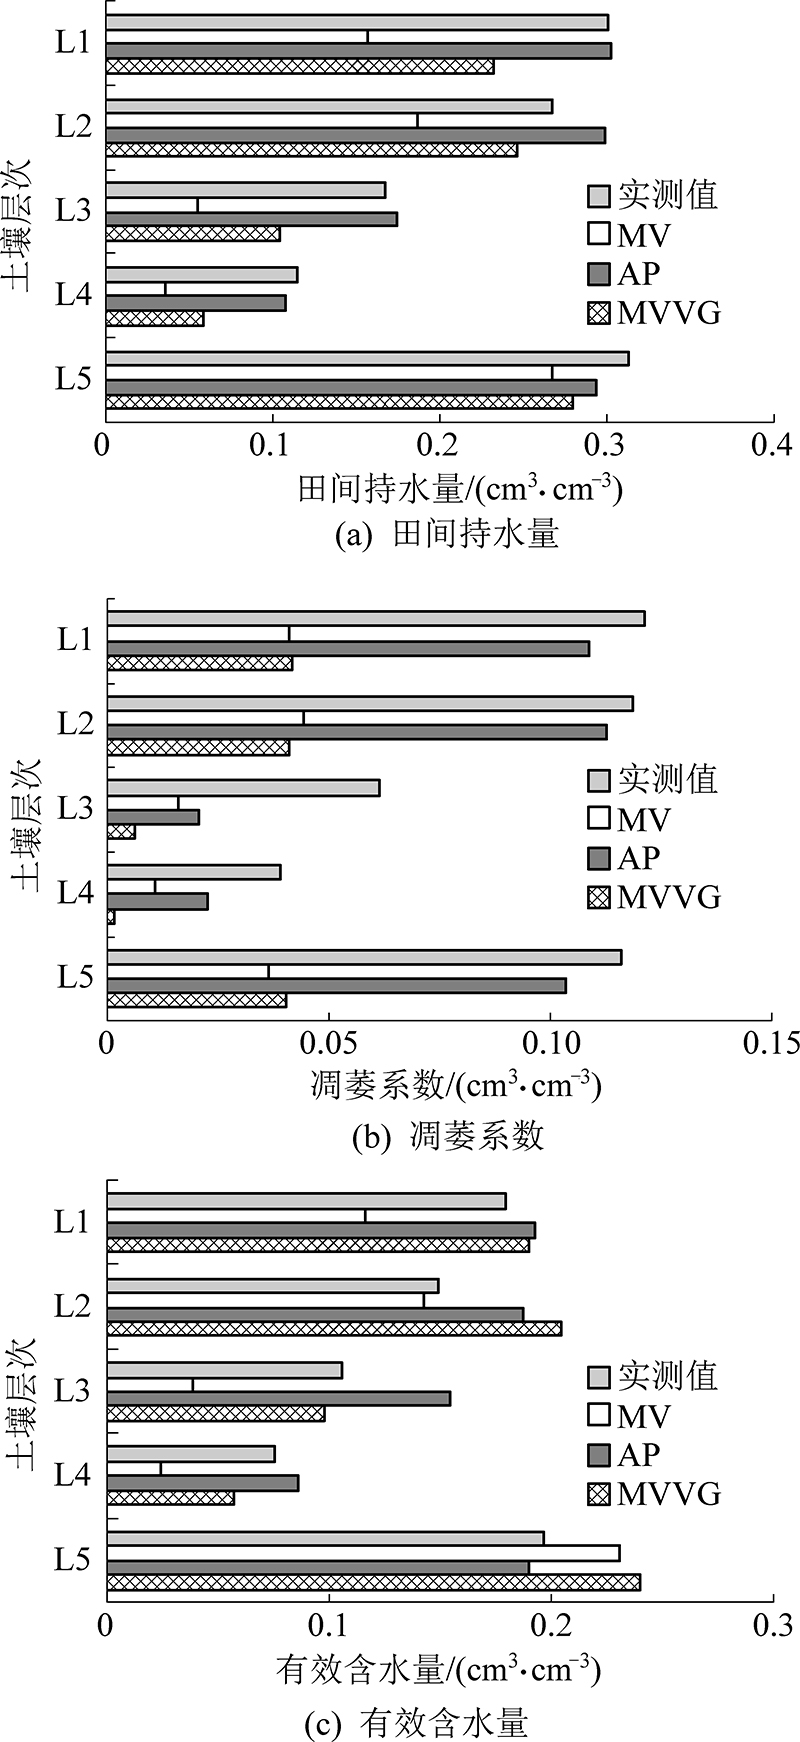
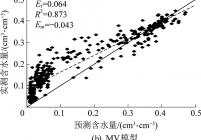
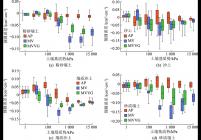
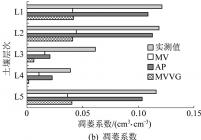
    露天矿开采导致大面积的地貌改变和植被破坏,进行土地复垦是重建原有生态系统的有效手段。为改善锡林浩特矿区生态脆弱、且矿区表土稀缺的现状,利用上覆岩层进行表土替代材料的开发,上覆岩层土壤的持水能力是选择表土替代材料的重要指标,对于指导排土场复垦具有重要意义。基于此选取了AP(Arya and Paris模型)、MV(Mohammadi and Vanclooster模型)和MVVG(MV model with the van Genuchten模型)3种模型对锡林浩特矿区上覆岩层(L1—L5,共5层)土壤水分特征曲线与土壤有效含水量的预测精度。结果显示:MVVG对于土壤水分特征曲线(R2=0.940)与有效含水量(R2=0.7409)的预测精度均较好,AP对于土壤水分特征曲线的预测结果最好(R2=0.950),且对于剖面有效含水量的预测趋势与实测值一致,但是有效水含量的预测值与实测值R2较低(R2=0.491),MV预测结果最差。AP模型对壤质沙土、砂之壤土和粉砂壤土的水分特征曲线预测效果好于MV和MVVG,但是各模型对沙土的预测预测效果均较差。除L5层,其余4层随着土壤层次深度的增加,其田间持水量、凋萎系数和有效水含量均呈减少趋势。L2—L4的有效水含量均低于L1(18%),且L4(8%)<L3(11%)<L2(15%)。研究结果显示AP和MVVG模型可以准确地预测研究区土壤水分特征曲线和水分常数,适合用于锡林浩特矿区上覆岩层土壤持水能力的预测。同时结果表明,L5层的有效含水量最大(20%),且土层较厚,具有在土地复垦过程中作为表土替代材料的潜力,而L2—L4可以考虑作为中和L5质地过黏的材料,使其土质更加接近腐殖层土壤(L1)。


  • Abstract
    Topsoil is stripped away by open-pit mining which resulting in large-scale landform changes and vegetation damage.Land reclamation is an effective ways of reconstructing the original ecosystem.The eastern part of Inner Mongolia is fragile and the topsoil is scarce.It is great significance to try to use the overburden to carry out the development of topsoil alternative materials.The water holding capacity of overburden is an important indicator for selecting as topsoil alternative materials, which is useful for guiding the reclamation of the dumping site.However, the direct measurement of soil water characteristic curve is costly and time-consuming.This paper compares the prediction accuracy of soil water characteristic curve and soil available water content in overburden (L1—L5,5 layers) by AP (Arya and Paris model), MV (Mohammadi and Vanclooster model) and MVVG (MV model with the van Genuchten).The results showed that MVVG had better prediction accuracy for soil water characteristic curve (R2 = 0.940) and effective water content (R2 = 0.7409), and AP had the best prediction result for soil water characteristic curve (R2 = 0.950), but it was lower for predicting effective water content (R2 =0.490 8) and the predicted results of MV and UNSODA were poorest.The prediction performance of AP model on loamy sand,sandy loam and silt loam in SWCC was better than MV and MVVG, but the prediction performance of all models on sand soil was poor.In addition to the L5 layer, the remaining four layers showed a decreasing trend in field water holding capacity, wilting coefficient and effective water content as the depth of the soil layer increased.Moreover, the effective water content of L2—L4 was lower than L1 (18%), and L4(8%) <L3 (11%) < L2 (15%).Through comparative analysis, this paper considered that the prediction results of MVVG and AP were relatively accurate, and it was suitable for the prediction of soil water holding capacity of overburden.At the same time, the results showed that the L5 layer had the largest effective water content (20%) and had the potential as topsoil alternative materials, and L2—L4 could be used as a material that neutralizes sticky of L5 to bring the soil texture closer to the humus soil (L1).
  • 关键词

    土地复垦土壤重构水分特征曲线土壤有效水

  • KeyWords

    land reclamation;soil reconstruction;water characteristic curve;soil available water content

  • 相关文章
  • 相关专题
  • 图表
相关问题

主办单位:煤炭科学研究总院有限公司 中国煤炭学会学术期刊工作委员会

©版权所有2015 煤炭科学研究总院有限公司 地址:北京市朝阳区和平里青年沟东路煤炭大厦 邮编:100013
京ICP备05086979号-16  技术支持:云智互联